MassiveHand Campaign Works™ contains information about your marketing activities and your contacts. As a marketer, you can can use the reporting tools in each MassiveHand Campaign Works™ instance to track marketing metrics, identify effectiveness of marketing activities (or areas for improvement), and troubleshoot or investigate if you’re curious about why something is happening.
This document details the most important information that applies to all report types. Individual report type documents contain more detailed information about building specific reports, particularly those that are commonly used by Acquia customers.
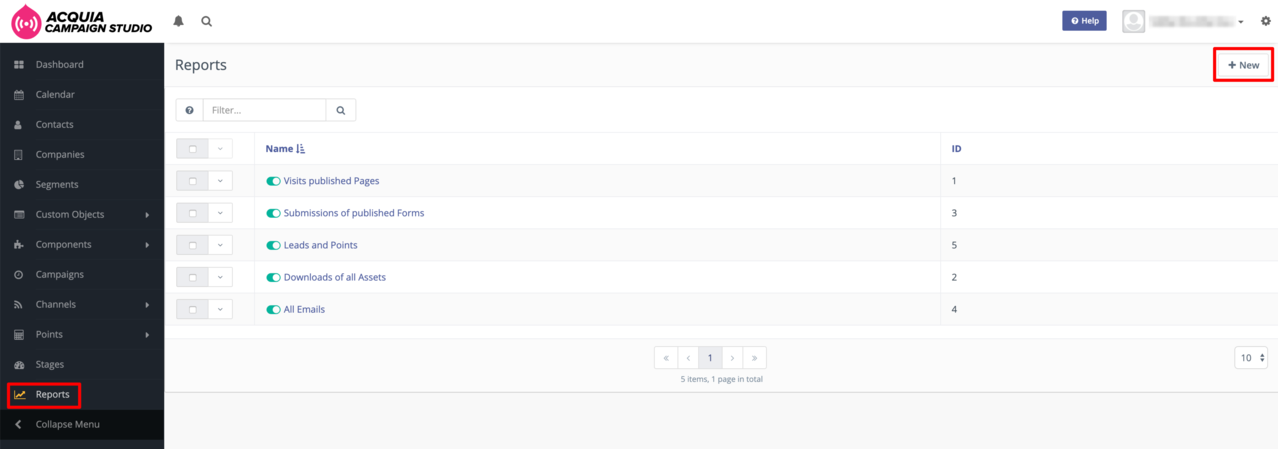
To get to reports, click the Reports link from the menu on the left side of your instance. To create a new report, click the New button in the top right corner.
Note
If your report is not rendered correctly, you can update update view in the URL to edit. This takes you to the edit mode and remove any filters that may have broken the report.
Details
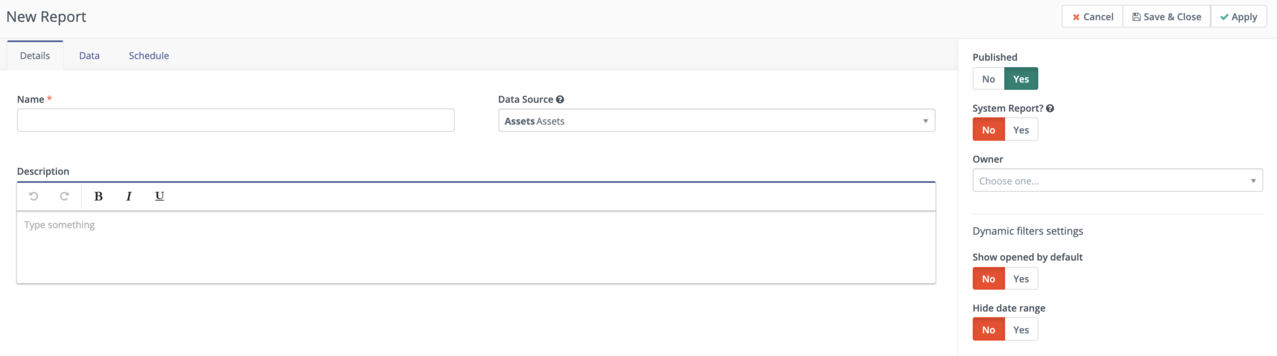
The Details tab on a report contains the same options across all reports and provides some general options for your report.
- Name: Specify a report name that makes it easy for you and other users to identify the purpose of the report.
- Data Source: Select the data source appropriate to the report that you are building. Note that each data source has a different set of available columns, filters, and graphs. The available data sources are:
- Assets: Assets
- Assets: Asset Downloads
- Campaigns: Campaign Events
- Channels Messages: Message Queue
- Emails: Emails
- Emails: Emails Sent
- Forms: Forms
- Forms: Form Submissions
- Contacts: Contacts
- Contacts: Multi Touch Attributions
- Contacts: First Touch Attributions
- Contacts: Last Touch Attributions
- Contacts: Contact Point Log
- Contacts: Frequency Rules
- Contacts: Segment Membership
- Contacts: Do Not Contact
- Contacts: UTM Codes
- Companies: Companies
- Mobile Notifications: Mobile Notifications
- Mobile Notifications: Mobile Notifications Sent
- Pages: Landing Pages
- Pages: Page Hits
- Videos: Video Hits
- Custom Objects: There will be data sources for each custom object you’ve created
- Description (optional): Add detailed information about the report, helping you and other users better understand what the report is for. You may want to include more information about filters, people, or departments.
- Published: Set this toggle bar to Yes to ensure that the report is active and can be sent at whatever schedule is set in the report options.
- System Report: Set this toggle bar to Yes so that all users can access the report. If set to No, only the owner of the report and users with permission to view others reports can see the report.
- Owner: Select the owner of the report to determine who can see the report if System Report is set to No.
- Dynamic filters settings: Show opened by default: If you want to ensure that the date filters and filter options for any other report filters are visible on a report detail page without needing to open the filters drop-down, set this toggle bar to Yes. For example, for an Emails report, you might want to view dynamic filters for Subject or Sent Date.
- Dynamic filters settings: Hide date range: To hide the date range filter so that users can’t change the dates that the report displays data for, set the toggle bar to Yes.
Data
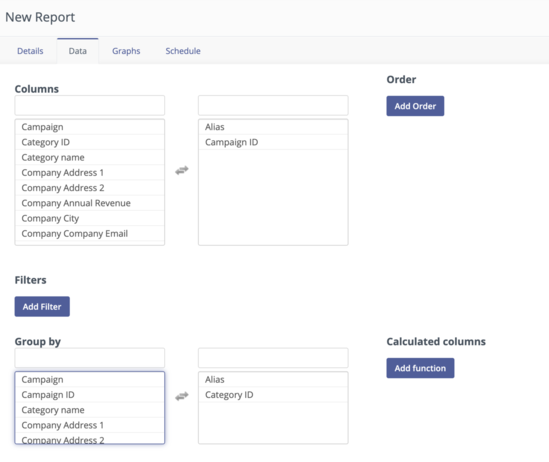
- Columns: Select the columns of data that you want to appear in the table of data in the report. To select a column to appear, click the column name in the left column. To clear a column, click it from the right column. For example, if you select ID, it refers to the ID for the parent data source category that you selected earlier (Contact ID, email ID, Asset ID, etc). It is recommended that you include ID in all reports.
- Order: Select data points to be used for sorting the data in the report. The available sort options are Ascending and Descending. To add multiple columns, click Add Order. For fields that use text, an Ascending order lists values starting with B after values starting with A (and so on). For number or date fields, the higher the number or later the date, the lower on the list the row is. Descending order is the opposite.NoteIf you add multiple fields to order by, the last one in the Order list is used first. For example, if you order by First Name Ascending and then add Email Ascending, the email column is sorted first and any duplicate rows is then sorted by first name ascending.
- Filters: Filter the data by using conditions and values. Hence, you can generate granular reports. This option helps you to narrow down the data included in the report. The data points used for filters don’t have to be columns that appear in the report table. A commonly used filter for any reports that include contact record data is Email Not Empty, which displays only identified contacts in the report. Additional use cases can be including contacts or items that match a certain value, events happening within a certain date range, etc.NoteSetting the Dynamic option to Yes makes it easier for users viewing the report to change the data they see without actually editing the report. Users can see the filter by opening the Filters drop-down from the top of the report page.
- Group by: Select the columns for which you want to group data. By default, reports show all items individually. In many reports, you may see the same contact, company, or item appear multiple times. To only see each record listed once, you can add a grouping based on some attribute for the record. You can use email or Contact ID to display a single row per contact record.For example, you can group by Contact ID to view the unique number of Asset Downloads or Form Submissions for a single form, instead of total Asset Downloads or Form Submissions, which could include duplicates.
- Calculated columns: Select the function that you want to apply to individual columns. Calculated columns display count, average, sum, or the minimum or maximum values from a selected field. They are only available when a grouping is used to show a calculation for that grouping. Continuing with the previous example of grouping by a contact ID number or email address, a COUNT calculation displays how many times that contact record appears on the report if not for the grouping.Example 1:In a Page Hits report (to find the number of hits to a MassiveHand Campaign Works™ Landing Page or any third-party page)
- Add the columns that you want in the report.
- Group by Hit URL (so only one URL is displayed per row).
- To calculate how many contacts hit that page:
- Select the COUNT function.
- Add Contact ID to the Column.
- MassiveHand Campaign Works™ counts how many Contact IDs hit that URL. The number in each row of the Count Contact ID column is the number of hits for that corresponding URL.
- Create a report with Emails as the data source.
- Add the columns that you want in the report.
- Group by ID (so only one email is displayed per row).
- Select the SUM function and add Read count to the column.
Graphs
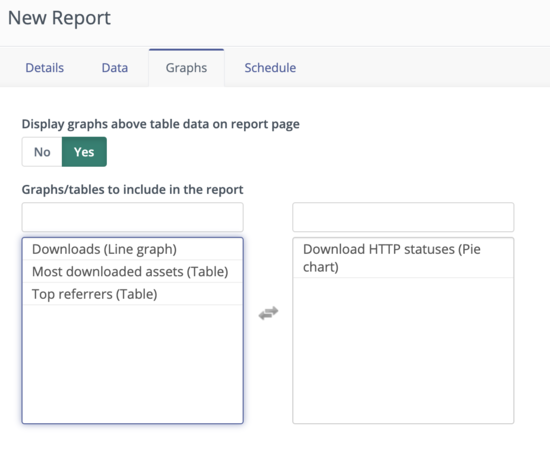
Some report types display graphs for visualization purposes. You can include such graphs in reports and use them in dashboard widgets.
- To select an available graph and add it to the report, click the name of the graph to move it from the left column to the right.
- To remove a graph from a report, click the name in the right column to move it to the left.
The availability and types of graphs vary by report type. For more information on the available graphs, see the help topics for each report type.
Schedule
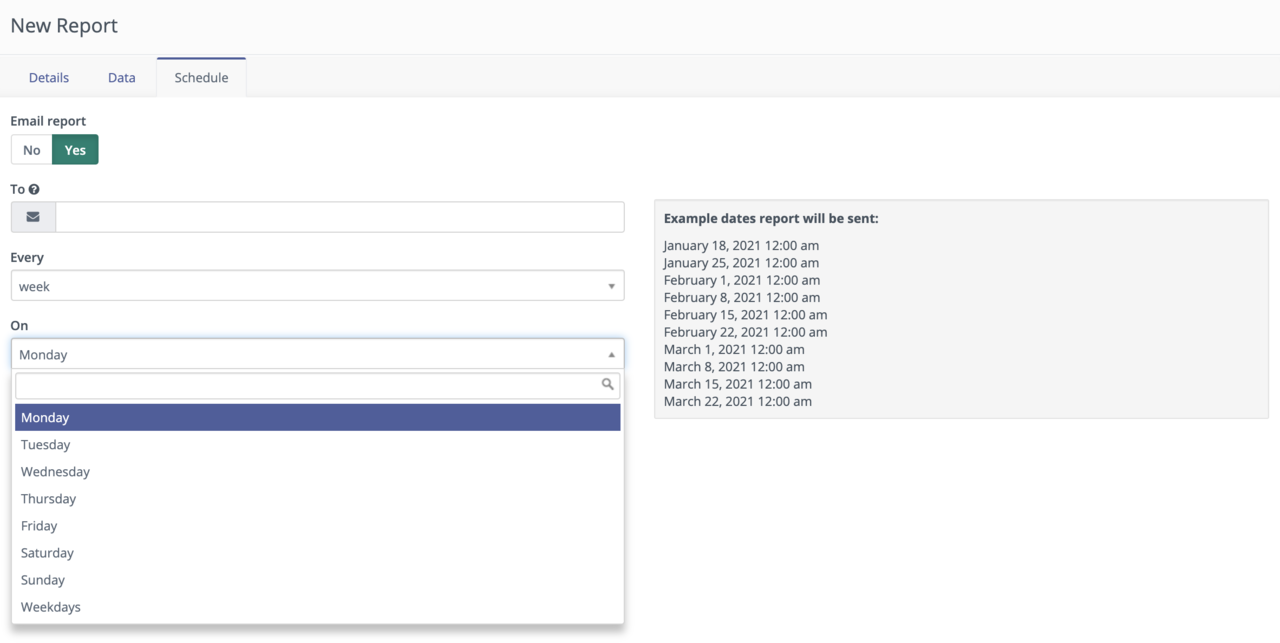
MassiveHand Campaign Works™ enables you to regularly email reports.
- Email report: Set this toggle bar to Yes to see additional options.
- To: Specify the email addresses that should receive the report. To send to multiple recipients, separate their email addresses with a comma. For example,
recipient1@yourcompany.com, recipient2@yourcompany.com. - Every: Select the frequency with which you’d like to automatically send the report:
- now: Sends the report once, when the report is saved.
- day: Sends the report every day at midnight in your time zone.
- week: After selecting week, select the day of the week you’d like to send the report. The report is sent at midnight in your time zone each week on the selected day.
- month: After selecting month, select either first or last and a day of the week. For example, set your report to be automatically sent on the first Monday or last Friday of each month. Alternatively, you can select Weekdays to send the report on the first or last weekday of each month.
MassiveHand Campaign Works™ displays example dates when the report will be sent. Hence, you can verify that the selection you’ve made is what’s intended.
Once you’ve set all of the options you’d like in the Details, Data, Graphs, and Schedule tabs, click Save & Close to save the report. Clicking Apply saves the progress you’ve made on building the report and keeps you in the edit mode.
Report Options
Once you’ve saved the report, go to your reports list to see the new report.
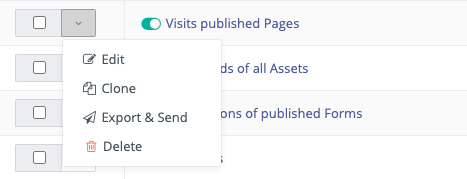
To view additional options for report, click the drop-down menu next to the check box.
- Edit takes you directly to the edit mode, rather than clicking on the view page and editing from there.
- Clone copies the report so that you can make small adjustments in a similar but new report, while maintaining the original report.
- Export & Send sends a .csv with the report data to the email address on your MassiveHand Campaign Works™ user profile.
- Delete deletes the report immediately.
Exporting reports
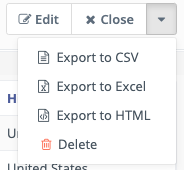
In addition to the scheduled send and the export and send feature, MassiveHand Campaign Works™ supports exporting reports to CSV, Excel, or HTML formats. From the reports list, click any report. Open the drop-down menu in the top right corner and select the preferred export format.
Reporting data is also available to export by API. For more information, see the API documentation.
Changing dates
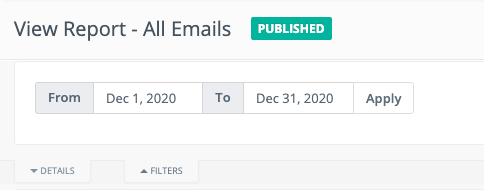
To adjust the dates for the data included in the report, open the Filters drop-down at the top of the report.
Note
If you see a spinning wheel after clicking Apply, refresh the page, set your preferred dates again, and click Apply.